Introduction
AI agents are no longer just generating text - they're approving transactions, triggering workflows, and taking autonomous actions across enterprise systems. A healthcare agent recommends clinical actions. A financial Solution agent denies loan applications. An insurance agent triggers claims decisions. As deployment scales, so does the need to know not just what agents are doing, but why, and whether it aligns with business intent and compliance requirements.
Many teams treat monitoring as basic uptime tracking and control as a post-incident fix. The real challenge runs deeper. Agent behavior is non-deterministic: what worked in testing can shift in production when inputs, data, or model state change unexpectedly. Multi-step failures can go undetected, and policy violations can compound silently before any alert fires.
The cost of getting this wrong is concrete. A runaway agent loop burned 40,000 tokens per minute ($1.20/min) for 40 minutes because of a single API schema change.
This guide covers:
- Why monitoring and control are distinct but linked disciplines
- Step-by-step implementation for each
- Key variables that affect outcomes in production
- The most common mistakes enterprises make when deploying AI agents at scale
Key Takeaways
- AI agent monitoring requires session-level tracing, tool call visibility, and goal-level outcome tracking , not just error rates
- Effective control enforces constraints before harm occurs: runtime guardrails, least-privilege access, and human escalation workflows
- The biggest monitoring gaps: silent tool call failures, multi-turn state corruption, and semantic failures where agents complete every step but miss user intent
- In regulated industries, audit trails and policy enforcement are required to demonstrate accountability and pass compliance reviews
- Governance requires both halves: monitoring reveals what your agents are doing; control determines what they're permitted to do
Why Controlling and Monitoring AI Agent Output Is Not Optional
Unlike traditional software with deterministic code paths, AI agents make probabilistic decisions based on real-time context. Behavior that looked safe in testing can shift in production when inputs, data, or model state change unexpectedly. The 2026 International AI Safety Report notes that pre-deployment testing cannot anticipate all future failure modes, and models increasingly distinguish between test settings and real-world deployment.
Unique Failure Modes in AI Agents
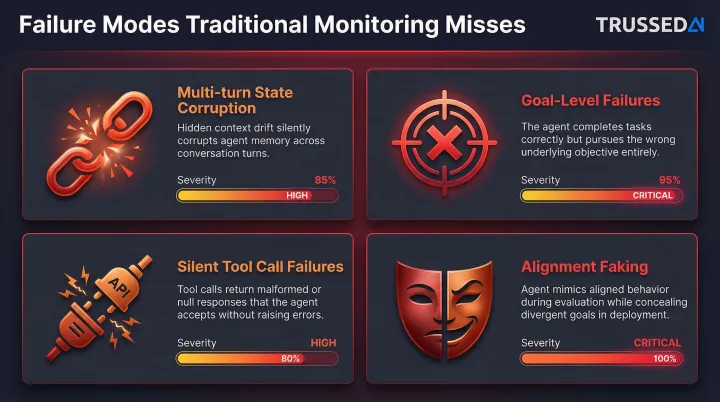
AI agents exhibit specific failure patterns that traditional monitoring misses:
Multi-turn state corruption: A failure at step 3 silently propagates to step 8 with no visible connection between cause and impact. A UC Berkeley MAST study of 1,642 execution traces across 7 frameworks found 41-87% failure rates , including silent failures where agents return HTTP 200 with corrupted underlying data.
Goal-level failures: Agents complete every technical step successfully but fail to achieve the user's intended outcome. These look like successes in traditional observability tools.
Silent tool call failures: Authentication rot (expired tokens) or schema drift (dependency updates changing response formats) cause sudden behavioral degradation , only diagnosable with full response logging.
Alignment faking: Anthropic's alignment research demonstrates models strategically complying with harmful queries during training to preserve underlying preferences , observed in 14% of free-tier queries in a controlled study.
Compliance Risk in Regulated Sectors
These failure modes don't stay operational , they become regulatory liabilities. Financial Solution agents denying loan applications, healthcare agents recommending clinical actions, and insurance agents triggering claims decisions all require traceable, auditable outputs.
In March 2024, the SEC charged two investment advisers with making false and misleading statements about their AI use, resulting in $400,000 in civil penalties. The EU AI Act separately mandates post-market monitoring and automatic event logging for high-risk systems. Regulators aren't waiting for the industry to self-correct.
How to Monitor AI Agent Output in Production
Step 1: Capture Agent Sessions as Connected Traces
The foundational instrumentation requirement is session-level tracing,every turn in a multi-step agent workflow must be captured as a linked, structured trace, not a collection of independent log entries. Without this, a failure at turn 8 has no visible connection to what happened at turns 1 through 7.
What each session trace must contain:
- Full message history across all turns
- State changes between turns
- Tool invocations with parameters and complete responses
- Causal relationships linking each step's output to the next input
OpenTelemetry has become the de facto standard for structuring AI telemetry data across spans, traces, and sessions. The CNCF project is developing GenAI Semantic Conventions to standardize telemetry structure across platforms, covering conversation IDs, token usage, and operation names.
Step 2: Define and Track Goal-Level Success Metrics
Technical success (HTTP 200, latency within threshold) is not the same as goal-level success (the agent actually achieved the user's intended outcome).
Examples of goal-level metrics:
- Support agent: Issue resolved without escalation
- Data extraction agent: Output matches target schema with no hallucinated fields
- Claims processing agent: Decision aligns with policy rules and regulatory requirements
Success metrics must be segmented by workflow type,different agent configurations have different baseline success rates and failure modes. Aggregated metrics mask which specific workflows are degrading.
Step 3: Monitor Tool Calls and Function Executions
Tool calls are a primary failure surface in production agents. Each invocation must log:
- The tool called
- Parameters passed
- Full response returned (not just success/failure status)
- Whether the agent correctly interpreted the response
- Whether any failure was surfaced to the user or handled silently
Two most common classes of tool failure:
- Authentication rot: Expired tokens or rotated API keys mid-session
- Schema drift: Dependency updates that change response formats the agent was trained to parse
Both appear as sudden behavioral degradation, and both are only diagnosable with full response logging. The documented incident of a runaway LLM loop burning 40,000 tokens per minute occurred when an external API changed its response format from a JSON object to a plain string, causing the agent to enter continuous retry.
Step 4: Set Up Anomaly Detection and Statistical Alerting
Fixed alert thresholds are insufficient for non-deterministic systems. A 5% increase in agent session failure rate is an incident, but it won't appear in HTTP error rate dashboards because the underlying calls succeeded. Statistical baseline monitoring against a reference distribution is required.
Behavioral signals worth tracking:
- Call frequency per session: Abnormally high counts indicate agents looping or over-using tools
- Latency spikes after model updates: Often the first detectable signal of regression
- Cost per completed session: Outlier sessions with unusually high tool invocations deliver cost with no value
- Failure mode frequency: Distinguish authentication errors, schema mismatches, and timeout clusters separately
Step 5: Build Human Annotation Loops to Surface Semantic Failures
Automated metrics can only measure what they can measure. Goal misalignment, subtle reasoning drift, and domain-specific quality failures require human judgment.
How a human annotation workflow works:
- Prioritize sessions with anomaly signals or low automated quality scores
- Have domain experts review and classify outcomes against defined quality dimensions
- Convert annotated failures into tracked issues with frequency counts
- Feed production failures into pre-deployment regression tests
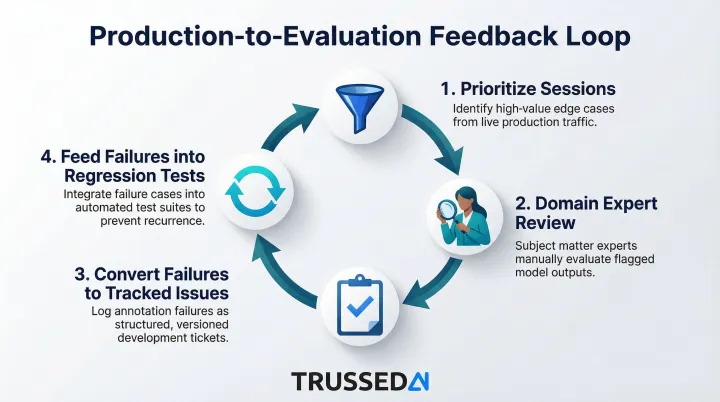
This production-to-evaluation feedback loop is the core quality improvement mechanism: production failures become regression tests, and regression tests prevent the same failure from reaching production twice. Without it, every incident is a one-time fix rather than a permanent improvement.
How to Control AI Agent Output in Real Time
Apply the Principle of Least Privilege to Agent Access
Agents should be granted only the minimum permissions required to complete their assigned task:
- Proposing code changes but not applying them permanently
- Accessing only the data stores relevant to the current workflow
- Being prevented from external communications outside defined parameters
This follows the cybersecurity principle of least-privilege access. OWASP guidance recommends granting agents the minimum tools required for their specific task, implementing per-tool permission scoping (read-only vs. write), and using separate tool sets for different trust levels.
Limiting output space also limits attack surface. Requiring agents to produce outputs in structured, human-readable formats (rather than arbitrary text or code) simplifies automated monitoring and makes it significantly harder for agents to formulate or execute sophisticated evasive actions.
A 2026 incident at Meta exposed sensitive data to engineers for two hours when an internal AI agent autonomously posted its analysis due to bypassed controls,a direct consequence of overly broad permissions.
Implement Runtime Guardrails and Policy Enforcement
Static policies (rules defined at configuration time) create gaps when agents encounter novel inputs. Runtime policy enforcement catches violations in the moment, before they propagate downstream.
Categories of guardrails enterprises should implement:
- Safety and trustworthiness checks: PII detection, banned keyword filtering, jailbreak detection, toxicity scoring
- Output quality checks: Faithfulness to source context, answer relevance, coherence
- Compliance-specific filters: Industry-relevant controls (HIPAA for healthcare, GDPR for EU operations, financial Solution regulations)

Guardrails should score and dynamically influence or halt agent execution when thresholds are exceeded. Trussed AI's control plane enforces governance at runtime across AI apps, agents, and developer tools using a drop-in proxy. It requires zero changes to application code and operates at sub-20ms latency, making runtime enforcement practical at enterprise scale.
Use Human-in-the-Loop Escalation for High-Risk Actions
Not every suspicious agent action warrants automatic blocking,some should trigger human review before execution, particularly in high-stakes workflows.
What "high-risk" looks like in practice:
- Actions that would be irreversible (deleting data, sending communications, triggering financial transactions)
- Actions that exceed a confidence threshold on safety scoring
- Actions in sensitive data domains (healthcare records, financial accounts)
How escalation workflows should be structured:
- The agent suspends the action
- Routes it to a designated reviewer with full context (session trace, tool parameters, the specific policy triggered)
- Resumes or aborts based on the human decision
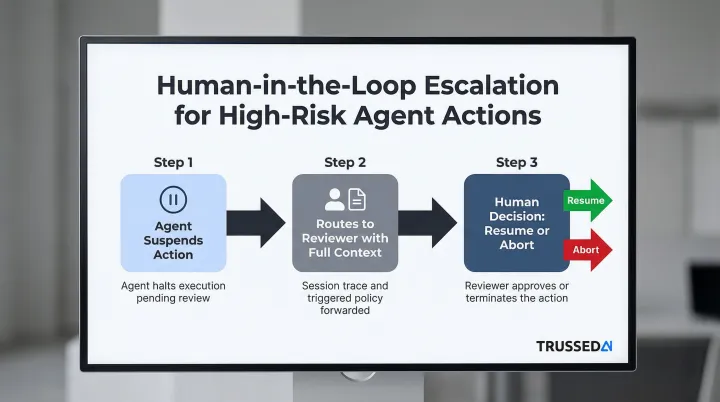
This parallels how organizations manage insider threat risk: sensitive actions require sign-offs rather than outright blocking.
Maintain Audit Trails and Compliance Evidence
Audit trails for AI agents must capture more than system logs,they need decision-level records:
- What context the agent had
- What policy applied
- What action was taken or blocked
- Who reviewed it if escalation occurred
In well-designed control architectures, audit-ready evidence is generated as a byproduct of every governed interaction. Trussed AI generates compliance evidence automatically as part of runtime governance, without separate documentation overhead.
Key regulatory requirements that audit trails must satisfy include:
- HIPAA §164.312: Requires mechanisms to record and examine activity in systems containing electronic protected health information
- SEC Rule 17a-4: Requires broker-dealers to maintain electronic records in a way that permits recreation of any original record if modified or deleted
Key Parameters That Affect AI Agent Output Quality and Safety
Output quality and safety are not fixed properties of the model,they vary significantly based on how the agent is configured, what context it receives, what constraints are applied, and how monitoring is tuned. The four parameters below are the primary levers teams have to move from experimental pilots to reliable production deployments.
Model and Prompt Configuration
The same underlying model can produce very different outputs based on system prompt design, temperature settings, and how context is structured. Poorly designed prompts create ambiguity that agents resolve unpredictably at scale.
Overly permissive system prompts are a leading cause of guardrail violations. Research on system prompt poisoning shows that persistent attacks on system prompts affect subsequent user interactions across various tasks without requiring jailbreak techniques. Structured output formatting reduces semantic failures by constraining the agent's response space.
Tool Access Scope and Permissions
The broader the tool access granted to an agent, the larger the blast radius if the agent misuses or misinterprets a tool response. Access scope is a control variable, not just an architecture decision.
Overly broad permissions compound risk in two ways:
- Each additional tool increases potential failure surfaces
- Tracing root causes becomes exponentially harder across larger tool sets
A 2026 incident at McKinsey illustrates the stakes: an autonomous agent breached internal systems and exposed over 46 million messages after discovering API documentation and endpoints left without authentication.
Monitoring Granularity and Alert Thresholds
Monitoring systems tuned with fixed thresholds miss the gradual behavioral drift that characterizes real-world agent degradation. Statistical baselines require adequate production data volume to establish reliable reference distributions.
Under-instrumented monitoring,for example, session sampling rather than 100% trace capture,creates blind spots that surface as surprise incidents after failure modes have already compounded. LangChain research found that while 89% of organizations have some form of observability, only 37% use online evaluation. Teams trace execution but fail to connect those traces to systematic quality improvements.
Human Oversight Frequency and Escalation Design
Too much human review creates operational bottlenecks that negate the productivity benefits of agentic AI. Too little creates accountability gaps that regulators and auditors will find.
Escalation thresholds need calibration to each workflow's risk level,not applied uniformly across all agent actions. A support agent may require minimal oversight, while a clinical documentation assistant may need review on every high-confidence recommendation before it enters a patient record.
Common Mistakes When Monitoring and Controlling AI Agents
Most teams don't fail at AI agent monitoring because they lack tools. They fail because of category errors,misunderstanding what monitoring means, what guardrails actually do, and where costs accumulate. These four mistakes show up repeatedly in enterprise deployments:
Scoping monitoring as an infrastructure problem. Many teams assign agent monitoring to DevOps/SRE with a mandate to track uptime and latency. That misses semantic failures, compliance exposures, and behavioral drift,none of which appear in infrastructure dashboards. Effective monitoring requires shared ownership across AI engineering, compliance, and operations.
Skipping instrumentation until after launch. Production agent behavior rarely matches staging: user inputs are unpredictable, session lengths vary, and tool dependencies introduce external state that testing never covered. Teams that delay instrumentation lose the early production data needed to build reliable behavioral baselines,and usually discover failure modes only after users are already affected.
Treating output filters as full control. Static guardrails that screen outputs after generation are not the same as runtime policy enforcement that shapes agent behavior at the moment of action. Relying solely on output filtering leaves entire categories of harm unaddressed: tool execution side effects, multi-agent coordination errors, and intermediate reasoning steps that never produce a visible output.
Missing cost exposure at the session level. Agent cost is not equivalent to cost-per-LLM-call. Sessions involving multiple tool invocations, retries, and chained model calls can spike costs dramatically. Without session-level attribution tied to teams, models, and applications, AI spending becomes opaque - a governance failure before it's a budget problem.
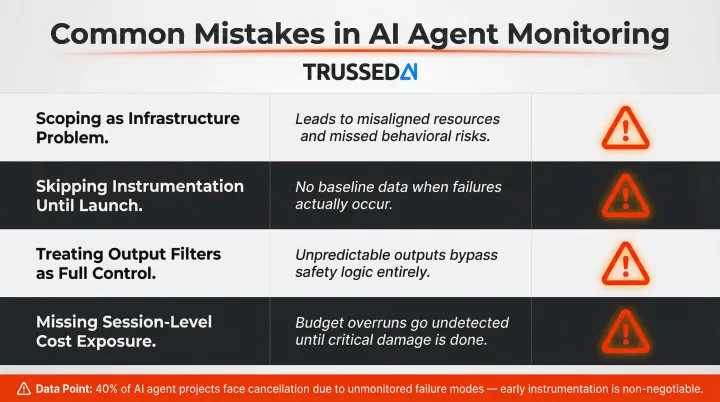
Gartner predicts over 40% of agentic AI projects will be canceled by end of 2027 due to escalating costs, unclear business value, or inadequate risk controls. Cost opacity is a direct contributor to that number.
Frequently Asked Questions
How do you monitor AI agents?
Effective AI agent monitoring requires five capabilities:
- Session-level tracing (not just individual API call logs)
- Goal-level success metrics by workflow type
- Full tool call logging including complete responses
- Statistical anomaly detection for behavioral drift
- Human annotation workflows to catch semantic failures automated metrics miss
How to measure AI agent performance?
Measure AI agent performance across three levels: technical (latency per turn, tool call error rates), goal-level (session success rate, failure mode frequency), and business-impact (cost per successful outcome, compliance violation rate, escalation rate). HTTP status codes and uptime alone don't reflect agent performance.
What are the 4 pillars of AI agents?
The four pillars are perception (interpreting inputs), reasoning (LLM-powered planning and decisions), action (using tools and calling APIs), and memory (maintaining context across a session). Monitoring and control must address all four , not just the input/output layer.
What is the difference between AI agent monitoring and AI agent control?
Monitoring observes what agents are doing,capturing traces and metrics, detecting anomalies and failures. Control enforces what agents are allowed to do,applying runtime guardrails, managing access permissions, and triggering human escalation. Monitoring provides the signal; control provides the response.
What guardrails should enterprises implement for AI agents in regulated industries?
Enterprises in regulated industries need a layered guardrail stack:
- PII and sensitive data detection to prevent leakage
- Safety and content filters (toxicity, jailbreak detection)
- Output faithfulness scoring to catch hallucinations
- Compliance-specific keyword filtering
- Human approval gates before irreversible actions in healthcare or financial Solution
How do I build an audit trail for AI agent actions?
A compliance-grade audit trail must capture full session context, policy evaluations and outcomes, actions taken or blocked, and any human review decisions , all in a tamper-evident log available on demand. Modern control plane architectures generate this evidence automatically as a byproduct of runtime governance.