Introduction
AI agents are no longer experimental prototypes confined to research labs. They're embedded in customer workflows, automating claims processing, and driving financial decisions across enterprise systems. Yet most organizations lack visibility into what those agents are actually doing, why they fail, and whether they're compliant with regulatory requirements.
AI agent adoption has outpaced the governance and visibility infrastructure needed to manage it safely. According to a 2025 McKinsey global survey, 62% of organizations are experimenting with AI agents and 23% are scaling them, yet only about 30% have mature governance models. Gartner predicts 40% of agentic AI projects will fail by 2027 due to missing controls, deepening exposure across regulatory risk, operational fragility, and cost.
The result leaves compliance teams, internal audit functions, and risk managers struggling to answer basic questions: What did the agent do? Why did it make that decision? Is it operating within policy?
TLDR:
- AI agent observability targets reasoning, tool calls, and decision paths, not just system health
- Traditional telemetry must be extended with evaluation and governance across the full agent lifecycle
- Multi-agent systems introduce coordination failure modes that single-agent frameworks miss
- For regulated enterprises, observability is the foundation of defensible AI governance
What is AI Agent Observability?
AI agent observability is the practice of achieving continuous, actionable visibility into an agent's reasoning, tool interactions, decision-making, and outcomes. It goes beyond confirming the system is running. It reveals how and why the system behaves as it does.
Traditional application monitoring tracks deterministic metrics: uptime, latency, CPU utilization, and HTTP status codes. These tools excel at detecting binary failures such as 503 errors, timeouts, and crashed Solution. But AI systems are probabilistic by design and make complex decisions in real time about what to do next. The same input can produce different outputs, and "normal" system metrics cannot signal whether the agent is reasoning correctly.
Key Questions Observability Answers
AI agent observability addresses questions that standard monitoring cannot:
- Why did the agent choose this tool? Understanding the reasoning path that led to a specific tool invocation
- What context shaped this decision? Identifying which inputs, retrieved documents, or conversation history influenced the outcome
- Where in a multi-step workflow did execution go wrong? Pinpointing the exact step where an agent deviated from expected behavior
- Was the agent's output compliant with policy? Validating that decisions adhered to regulatory and organizational requirements
Monitoring vs. Observability
Monitoring tells you what happened. Observability tells you why it happened, and what should have happened but didn't.
Traditional monitoring misses an entire category of failures that AI systems introduce:
- An agent silently skips an expected action with no error raised
- A response is factually incorrect but returns a 200 OK status
- Behavior gradually shifts over time as the model drifts
These are semantic failures. No alert fires. No dashboard turns red. They're invisible without observability built for AI-specific behavior.
Why Traditional Monitoring Falls Short for AI Agents
AI agents break the fundamental assumptions that traditional monitoring is built on. They are non-deterministic, reasoning-driven, and context-sensitive. Infrastructure health metrics like latency and uptime cannot signal whether an agent is reasoning correctly.
The Illusion of 200 OK
A request may succeed technically but fail functionally because the generated output is irrelevant, incorrect, or inconsistent. Traditional monitoring can miss root causes like a compromised boundary between untrusted external content and trusted agent context, where health metrics stay green but the system performs unintended actions.
Research shows that the optimal latency-quality balance varies by task. In some scenarios, sacrificing quality for lower latency enhances downstream performance. For LLMs specifically, response times vary dramatically under normal operation, creating noise that masks actual quality failures. Latency tells you nothing about whether the answer was right.
Context Window Overflow and the "Lost in the Middle" Phenomenon
LLMs have a finite attention budget. As context grows, precision drops. The "lost in the middle" phenomenon occurs when LLMs overlook information buried in the middle of long prompts, relying heavily on the beginning and end.
Context window overflow happens when the total number of tokens, including system prompt, retrieved documents, and conversation history, exceeds the model's context limit. The consequences include:
Context window overflow happens when the total number of tokens, including system prompt, retrieved documents, and conversation history, exceeds the model's context limit. The consequences are rarely obvious:
- Truncation or compression of earlier context without warning
- Explicit API errors that surface in logs but not in health dashboards
- Silent context loss: agents continue running while missing critical information, producing misinformed decisions that look like normal traffic to infrastructure monitors
Behavioral Drift: Silent Model Updates
Prompt drift is the gradual change in an LLM's output behavior over time, even when the prompt itself hasn't been modified, often caused by silent model updates from providers. A 2023 study evaluating GPT-3.5 and GPT-4 found that performance varied greatly over time. GPT-4's accuracy in identifying prime numbers dropped from 84% in March 2023 to 51% in June 2023.
A 2025 study demonstrated that drift occurs systematically across models like GPT-4, Claude 3, and Mixtral, affecting response length, factuality, and instruction adherence. Traditional monitoring treats this as normal activity because system-level metrics remain stable.
Cost Explosion in Autonomous Loops
Agentic systems can generate unpredictable costs due to iterative reasoning loops, retries, and unbounded tool usage. In one documented case study, a multi-agent system trapped in an endless dialogue loop for 11 days resulted in a $47,000 API bill.
Runaway costs can also stem from tool storms, where multiple agents hammer the same tool simultaneously, or from context inflation as conversation history balloons across turns. Because the system is technically responding to requests as designed, infrastructure metrics stay green. There is no built-in signal that the agent has entered a redundant loop, until the invoice arrives.
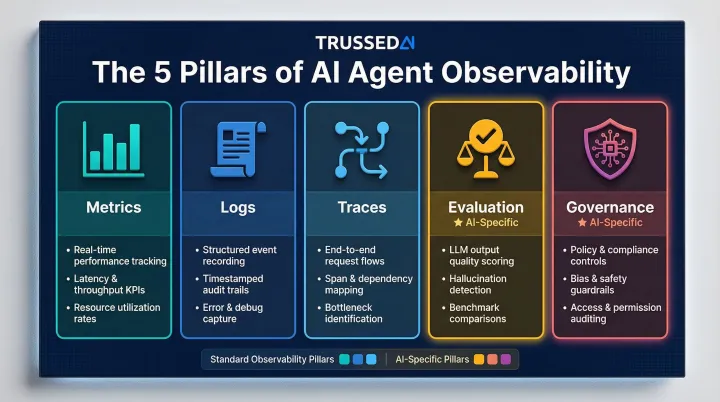
The Five Pillars of AI Agent Observability
The traditional three pillars of observability, Metrics, Logs, and Traces, are necessary but not sufficient for AI agents. Two additional pillars, Evaluation and Governance, are required to cover agent-specific behavior and compliance needs.
Metrics
AI-specific metrics go beyond standard CPU, memory, and uptime tracking:
- Token usage and cost-per-trace: Tracking input/output tokens and cost per task to prevent budget overruns
- Inference latency: Measuring response times, though this must be contextualized with quality metrics
- Tool call success rates: Monitoring how often tool invocations succeed versus fail
- Response quality scores: Assessing output relevance, accuracy, and alignment with user intent
- Model drift indicators: Detecting changes in response length, factuality, and instruction adherence over time
Each metric directly ties to business outcomes: cost efficiency, SLA adherence, and output reliability. Metrics tell you what happened numerically. Logs and Traces explain why.
Logs and Traces
Logs provide the detailed chronological record of agent decisions, tool calls, LLM interactions, and state changes. They are essential for compliance audits and root-cause analysis.
Traces capture the end-to-end journey of a user request through planning, tool invocation, LLM calls, and response generation. They provide the narrative that links metrics to causes, enabling teams to reconstruct the full execution path and identify where failures occurred.
Evaluation
Unlike traditional software, AI agents can produce outputs that are technically successful but contextually wrong. Evaluation addresses this gap by systematically assessing output quality, safety, and alignment with user intent through both automated LLM-as-a-judge methods and human-in-the-loop review.
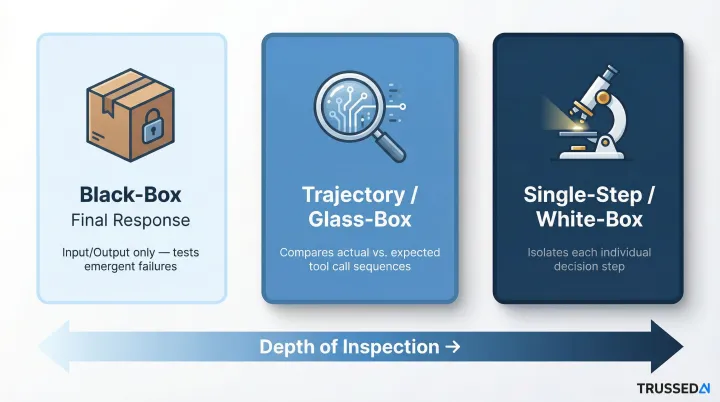
Three Evaluation Strategies:
| Strategy | Description | Use Case |
|---|---|---|
| Black-Box (Final Response) | Evaluates only the user's input and the agent's final answer, ignoring internal steps | Testing overall output quality and emergent failures |
| Trajectory (Glass-Box) | Compares the agent's actual sequence of tool calls against the expected sequence | Pinpointing where in the reasoning process a failure occurred |
| Single-Step (White-Box) | Tests each decision-making step in isolation to see if it produces the expected next action | Validating specific search queries, API parameters, or tool selections |
LLM-as-a-Judge: LLMs score and critique other LLM outputs at scale, making evaluation tractable for high-volume production systems. However, LLM evaluators can exhibit biases, notably self-preference, where a model favors outputs resembling its own generations.
Governance
Governance closes the loop by enforcing policies at runtime, detecting violations before they propagate, and generating audit-ready evidence as a byproduct of every governed interaction. This is the shift from reactive log review to proactive policy enforcement.
Observability with governance built in evaluates policy before every tool call, data access, and workflow trigger, keeping agents within defined boundaries continuously, not just during quarterly audits.
Observability in Multi-Agent Systems
Multi-agent architectures introduce a new class of failure modes. Individual agents may appear healthy in isolation while coordination failures, context handoff errors, and resource conflicts silently degrade the overall workflow.
Unique Failure Modes
Coordination Drift: The breakdown in multi-agent consensus mechanisms over extended interaction sequences, where agents gradually diverge in their understanding of shared goals.
Context Handoff Loss: Information lost when context is truncated or improperly passed between agents, such as when an agent's context exceeds token limits during handoff.
Infinite Loops: Agents getting stuck in semantic loops, repeating logic without progressing, leading to massive cost spikes.
Observability Requirements
Multi-agent systems require:
- A single trace ID that persists as requests flow through every agent handoff
- Coordination metrics covering message passing, task delegation, and shared memory access
- Failure attribution that pinpoints which agent or interaction broke down, not just that the system did
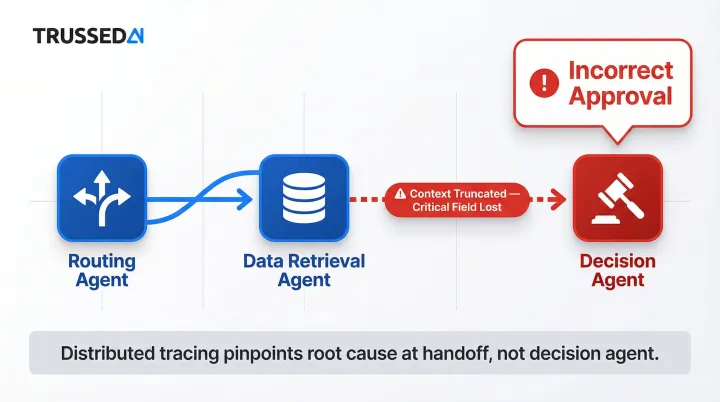
Concrete Example: Insurance Claims Workflow
Consider a multi-agent insurance claims workflow with three agents: a routing agent, a data retrieval agent, and a decision agent. Each produces clean logs showing successful execution. However, the distributed trace reveals that a context handoff corrupted the input to the decision agent. A critical context field was truncated, causing the decision agent to approve a claim it should have flagged for review.
Without distributed tracing, the failure looks like a decision agent error. Distributed tracing pinpoints the actual root cause: a context handoff failure between the retrieval and decision agents.
Observability as an Enterprise Governance Imperative
In healthcare, insurance, and financial Solution, AI agents are already making decisions that regulators expect organizations to explain, document, and defend. Observability isn't a technical nicety here. It's a compliance requirement with teeth.
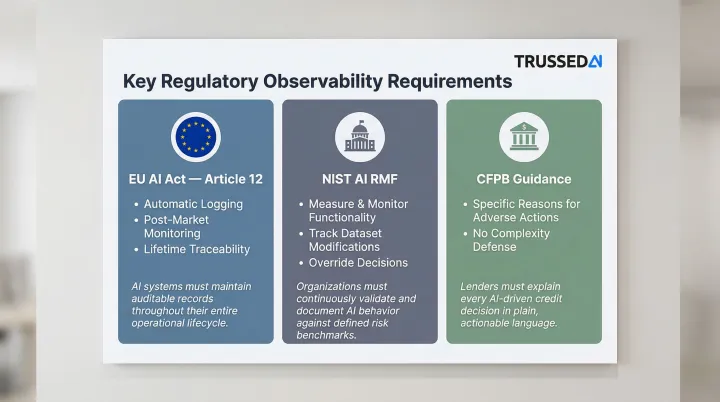
Regulatory Requirements
EU AI Act Article 12: The EU AI Act mandates automatic logging and post-market monitoring for high-risk AI systems. Article 12 requires that high-risk AI systems technically allow for the automatic recording of events over their lifetime to ensure traceability.
NIST AI RMF: The NIST AI Risk Management Framework emphasizes the need to measure and monitor AI system functionality and behavior in production, including tracking dataset modifications and overriding decisions to ensure information integrity.
CFPB Guidance: The Consumer Financial Protection Bureau has clarified that creditors must provide specific and accurate reasons for adverse actions, even when using complex algorithms. Companies cannot claim complexity or opaqueness as a defense against violations.
Compliance Risks of Unobserved AI Agents
Organizations without observability face:
- No audit trail showing how decisions were reached, a direct exposure under CFPB and EU AI Act requirements
- Agents accessing data outside approved policy boundaries without detection or alerting
- Missing evidence for compliance reviews, leaving organizations unable to respond to regulatory inquiries
Governance-Integrated Observability Architecture
Effective enterprise observability includes:
- Evaluates policy at the inference layer before every model interaction, not after the fact
- Detects and redacts PII automatically before sensitive data reaches a model or external system
- Generates audit trails as a byproduct of normal agent operation, not a retroactive reporting task
- Restricts access to trace data and audit logs based on role, so sensitive decision records stay protected
Trussed AI's control plane delivers this architecture as a drop-in proxy, with no changes to application code required. It enforces policies at runtime across models, agents, and workflows, generates governance evidence automatically at under 20ms latency, and keeps compliance violations below 1%. Any decision can be traced on demand, from the original prompt through the model response to the final action taken.
Best Practices for Implementing Agent Observability at Enterprise Scale
Instrument from Day One and Adopt OpenTelemetry
OpenTelemetry has emerged as the industry standard for agent telemetry. Many frameworks including Pydantic AI, smolagents, and Amazon Bedrock natively emit OpenTelemetry traces. Adopting OpenTelemetry from the start prevents vendor lock-in and ensures consistent data collection across frameworks, clouds, and teams.
Major frameworks have already standardized on OTel, so the ecosystem supports you:
| Framework | OpenTelemetry Support |
|---|---|
| LangChain / LangSmith | Supports OTel-based tracing; enables tracing complete LLM applications |
| AutoGen | Native support for OTel, instrumenting runtime, tools, and agents using GenAI semantic conventions |
| CrewAI | Exports OTel traces and logs directly to collectors |
| Amazon Bedrock AgentCore | Emits telemetry in OTel-compatible format |
| Pydantic AI | Built-in support for OTel following GenAI semantic conventions |
| smolagents | Adopts OTel standard for instrumenting agent runs |
Define Business-Aligned KPIs Before Deploying Agents
Observability only delivers value when metrics are tied to outcomes. Establish baselines before production deployment so drift is detectable.
Critical KPIs:
- Goal completion rate
- Cost-per-decision
- Compliance violation rate
- Tool accuracy
- Response quality scores
Generic latency dashboards tell you the system is slow, but they won't tell you it's failing your customers. These KPIs will.
Build Continuous Evaluation into CI/CD Pipelines
Automated evaluation should function as a hard gate in your pipeline. Running quality, safety, and compliance checks on every code change prevents regressions and ensures each iteration is production-ready before it reaches real users.
A 2026 case study demonstrated an automated self-testing framework that uses a deterministic PROMOTE/HOLD/ROLLBACK decision protocol based on five dimensions:
- Task success rate
- Research context preservation
- P95 latency
- Safety pass rate
- Evidence coverage
The gate identified and blocked two ROLLBACK-grade builds, both suffering systemic citation failures, before they reached production.
Frequently Asked Questions
How is AI agent observability different from traditional application monitoring?
Traditional monitoring focuses on infrastructure health, including CPU, uptime, and error rates. Agent observability targets the intelligence layer, capturing reasoning paths, tool usage, context decisions, and behavioral drift that system metrics cannot surface.
What are the most important metrics to track in AI agent observability?
Track both technical metrics (token usage, tool call success rates, inference latency, error rates) and outcome metrics (goal completion rate, cost-per-decision, response quality scores, compliance violation rate). Outcome metrics are what connect agent behavior to business results.
What is the role of OpenTelemetry in AI agent observability?
OpenTelemetry is the open standard for collecting and transmitting agent telemetry data, enabling consistent trace collection across different agent frameworks and cloud environments without tying you to a single vendor.
How does observability support AI compliance in regulated industries?
Observability generates the audit trails, decision logs, and policy enforcement evidence that regulated industries need to demonstrate compliance. Without it, organizations cannot reconstruct decision-making processes or prove policy adherence when regulators ask.
What are the biggest observability challenges in multi-agent systems?
The core challenge is attribution. When multiple agents collaborate, identifying which agent or handoff caused a failure requires end-to-end distributed tracing, not just per-agent monitoring. Without trace continuity, a failure in one handoff looks like a system-wide problem.